



What statistics does etoro track and where can I find them?
Last updated: 12 August 2026
If your profile is set to public, the Stats tab can be found by going to your profile page. It has useful insights into your portfolio performance, diversity, risk, dividends, and other metrics. Non-sensitive data is visible to other traders, making it a powerful tool for assessing whether to copy a trader or invest in a Smart Portfolio.
The statistics tab consists of several different cards, which are listed below. Click on the card name to learn more:
You can also access your portfolio stats by clicking on the bar chart symbol in the top right corner of your portfolio.
etoro AI
In etoro AI, your profile is a single scrolling page, so there is no separate Stats tab. Scroll down your profile to view your statistics. Many of the cards below are not currently available on etoro AI.
1. Performance
This card shows the yearly and monthly returns of your portfolio as a percentage. The percentage represents the net change in Portfolio Value during a given month.
The formula to calculate the monthly percentage is:
E1 – is the portfolio value at the end of the month
W – is the total amount of funds removed from the account within the month*
E0 – is the portfolio value at the beginning of the month
D – is the total amount of funds added to the account within the month*
*Funds added and removed from the account may include but are not limited to: deposits, withdrawals, adjustments due to technical issues or interest payments.
Yearly performance is calculated by multiplying the monthly returns throughout the year.
If the returns over 12 months are r1,r2,r3….r12 the formula is:
Yearly Performance = (1+r1)(1+r2)…(1+r12) -1
2. Breakdown
This card shows your portfolio's composition as a percentage according to different metrics. The metrics you can choose from are asset type, sector, country, and exchange. If you copy an investor or invest via a Smart Portfolio, you can select ‘Break down CopyTrader’ to include the assets you are copying in the overview of your portfolio’s composition.
The assets along the bottom are diversification opportunities for your portfolio, that have been increasing in popularity with etoro investors. Assets you see there are randomized on each visit.
3. Portfolio Risk
This card allows you to track your risk score over time, and also see which assets contribute most to your portfolio’s current risk score.
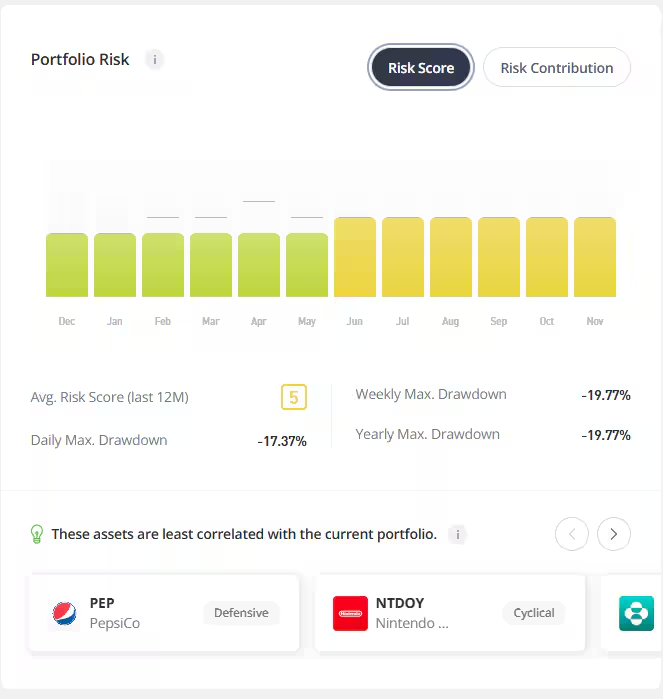

It also includes your average risk score over a 12-month period and your maximum drawdown across 3 timeframes. The maximum drawdown is the greatest loss your portfolio suffered during the period specified (daily, weekly, or all time).
The assets listed along the bottom have a low correlation with your current portfolio over the last 12 months. These are also randomized each time you load the page.
4. Expected Dividends
This card provides an estimate of your potential annual yield for dividend-paying stocks and ETFs in your portfolio. It does not include assets held in CopyTrader and Smart Portfolios. In addition, there are trending high dividend-paying stocks listed.
5. Copiers
This card displays how many active copiers an investor currently has, a chart tracking the number of copies over the previous 12 months, the total value of etoro clients’ money being used to copy the investor, and how many people have started or stopped copying the investor in the last 7 days.
6. Compare Portfolio
This card shows how your portfolio has performed in comparison to major indices and markets across varying time periods.
6. Trading
This card lets you review 12-month total trades, portfolio performance, percentage of profitable trades, and performance across all assets traded in the last 12 months.
7. Additional Statistics
This card at the bottom of the page shows some additional statistics such as trades per week, average holding time, and percentage of profitable weeks.
Was this article helpful?
Still need help?
We're happy to assist you, whenever you need us. Choose your preferred method of contact.